Contents of this page:
- Inflation, Consumer Price Index (CPI)
- Wage Growth, Average Hourly Earnings
- U.S. National Average Gas Prices
- National Debt
- Tax Legislation and U.S. Government Revenue Collections
- Unemployment Rate and Employment-Population Ratio
- Stock Market: Trump vs. Biden/Harris
- Inflation by Presidential Term (December 1969 to Present)
—————————————————————————————————
Inflation, Consumer Price Index (CPI)
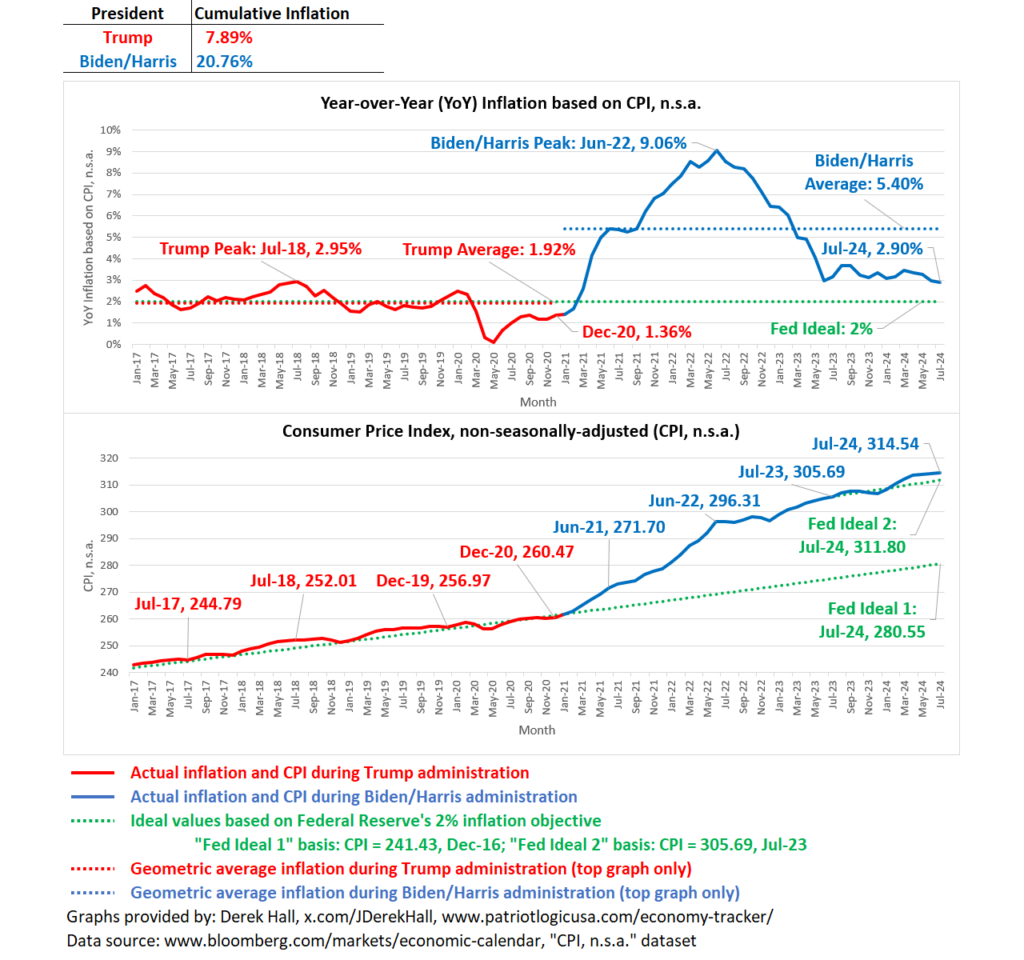
Year-over-Year (YoY) means a running 12-month period.
Averages labeled above are calculated geometrically, not arithmetically, because inflation rates are compounded over time.
—————————————————————————————————
Wage Growth, Average Hourly Earnings
—————————————————————————————————
U.S. National Average Gas Prices
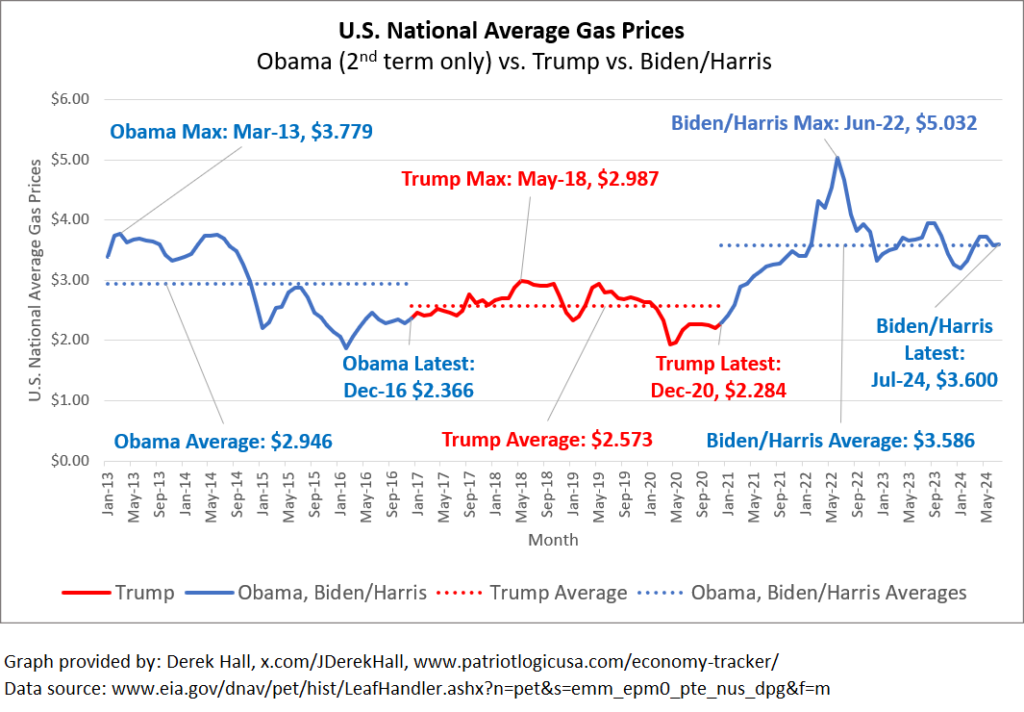
Averages in the graph above are simple averages calculated arithmetically.
—————————————————————————————————
National Debt
Annualized values = Total values scaled to 12-month period. Annualized values are more suitable for direct comparison.
| National Debt Reported 8/1/2024: $35,059,402,347,142 | ||
| Cumulative Debt Accumulation by White House Administration | Total | Annualized |
| Biden/Harris | $7,306,566,478,697 | $2,068,777,834,375 |
| Trump (Including COVID) | $7,808,406,651,338 | $1,952,101,662,835 |
| Trump (Before COVID) | $3,570,372,773,399 | $1,122,270,787,852 |
| Obama | $9,315,547,731,597 | $1,164,443,466,450 |
| Bush-43 | $4,901,104,747,205 | $612,638,093,401 |
See table below for greater detail on national debt progression.
| Record Date | National Debt | Increase | Notes |
| 8/1/2024 | $35,059,402,347,142 | $7,306,566,478,697 | Greatly increased routine spending by Biden administration, 1/20/2021 – 8/1/2024 |
| 1/19/2021 | $27,752,835,868,445 | $4,238,033,877,939 | Last full business day of Trump administration, COVID spending, 3/27/2020 – 1/19/2021 |
| 3/26/2020 | $23,514,801,990,506 | $3,570,372,773,399 | Before Trump signed CARES Act for COVID, 1/20/2017 – 3/26/2020 |
| 1/19/2017 | $19,944,429,217,107 | $9,315,547,731,597 | Last full business day of Obama administration, 1/20/2009 – 1/19/2017 |
| 1/16/2009 | $10,628,881,485,510 | $4,901,104,747,205 | Last full business day of Bush-43 administration, 1/20/2001 – 1/16/2009 |
| 1/19/2001 | $5,727,776,738,305 | Last full business day of Clinton administration |
1. https://fiscaldata.treasury.gov/datasets/debt-to-the-penny/debt-to-the-penny
2. https://fiscaldata.treasury.gov/datasets/historical-debt-outstanding/historical-debt-outstanding
—————————————————————————————————
Tax Legislation and U.S. Government Revenue Collections
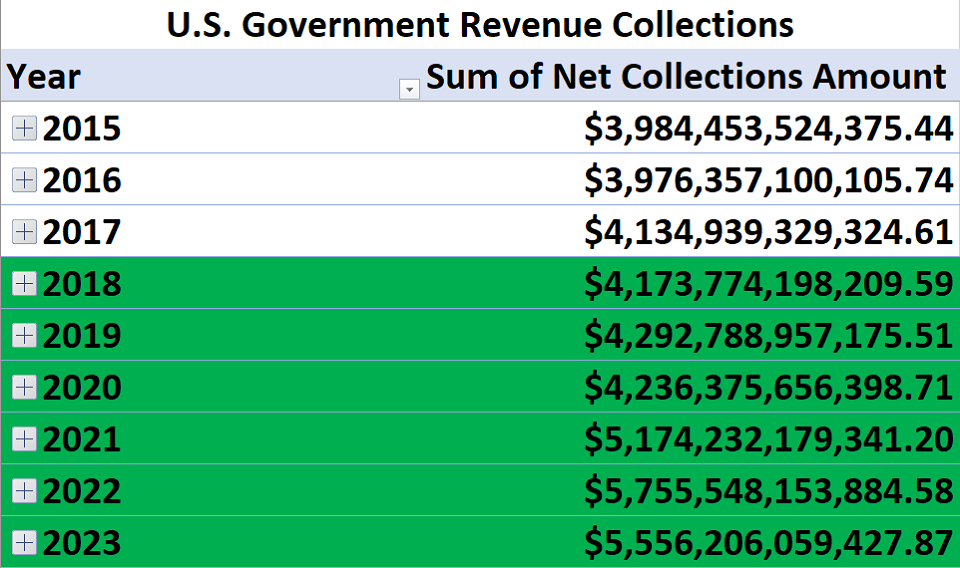
Trump’s Tax Cuts and Jobs Act (TCJA) went into effect on January 1, 2018, and will remain in effect through December 31, 2025. The TCJA reduced tax rates in almost all brackets, but government revenue has only increased during that time as shown in the table below. This trend refutes the idea that lower tax rates reduce overall tax revenue and thereby increase the budget deficit, although increased borrowing and spending will increase the deficit as the Biden administration has done.
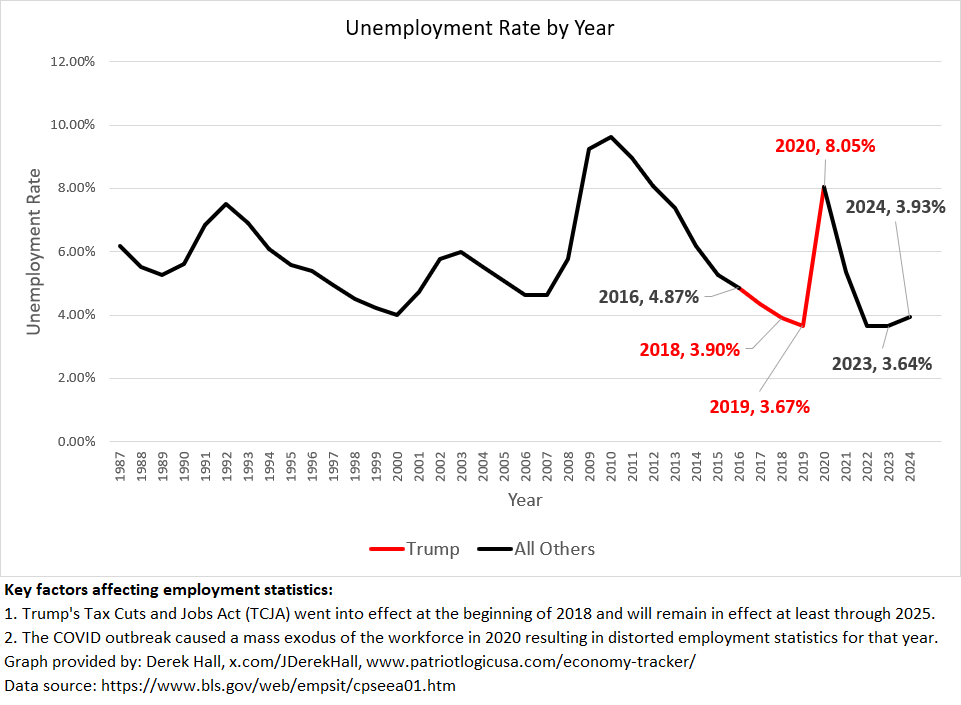
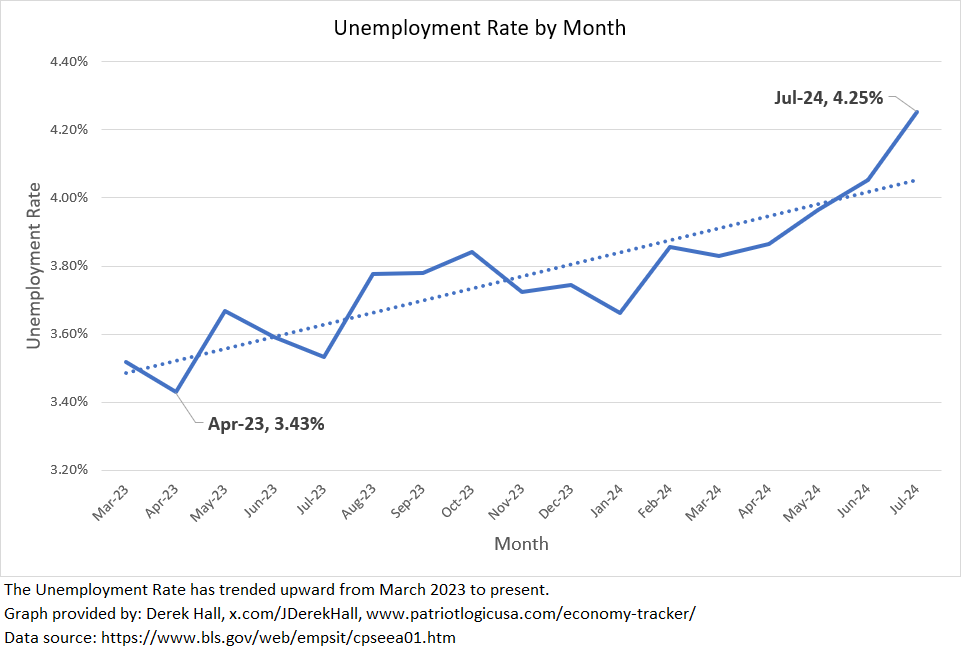
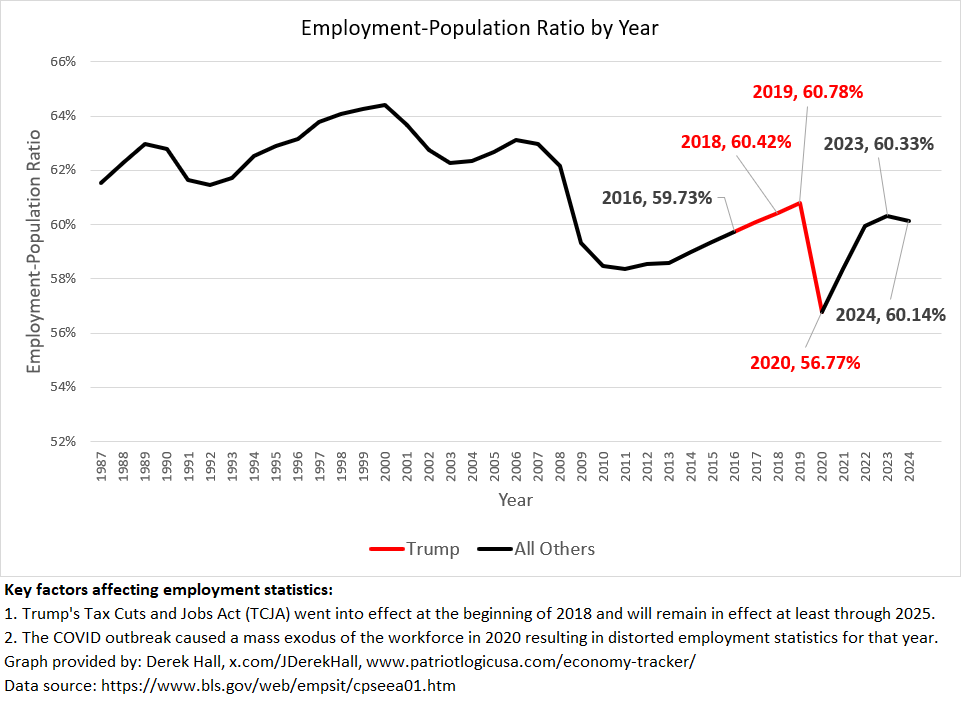
The TCJA’s lower tax rates reduced supply-side burdens and sparked economic growth, productivity, and job growth, all of which increased government tax revenue. The more recent low unemployment rates are largely the result of the TCJA’s reduced tax rates, although the Biden administration’s policies threaten to work against that success.
—————————————————————————————————
Unemployment Rate and Employment-Population Ratio
—————————————————————————————————
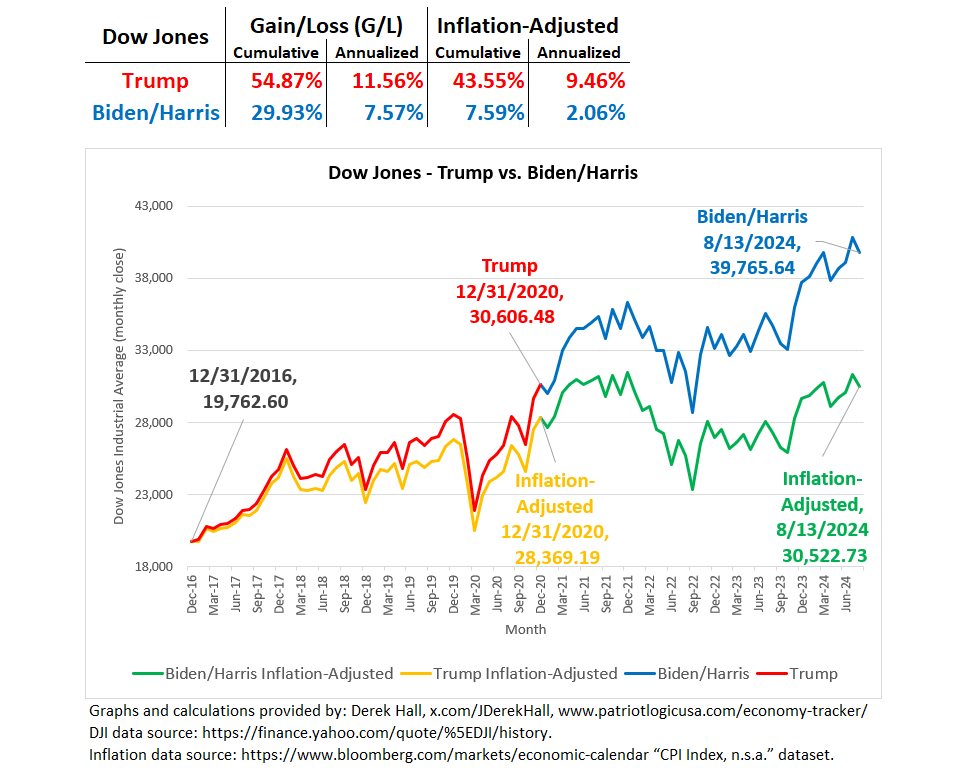
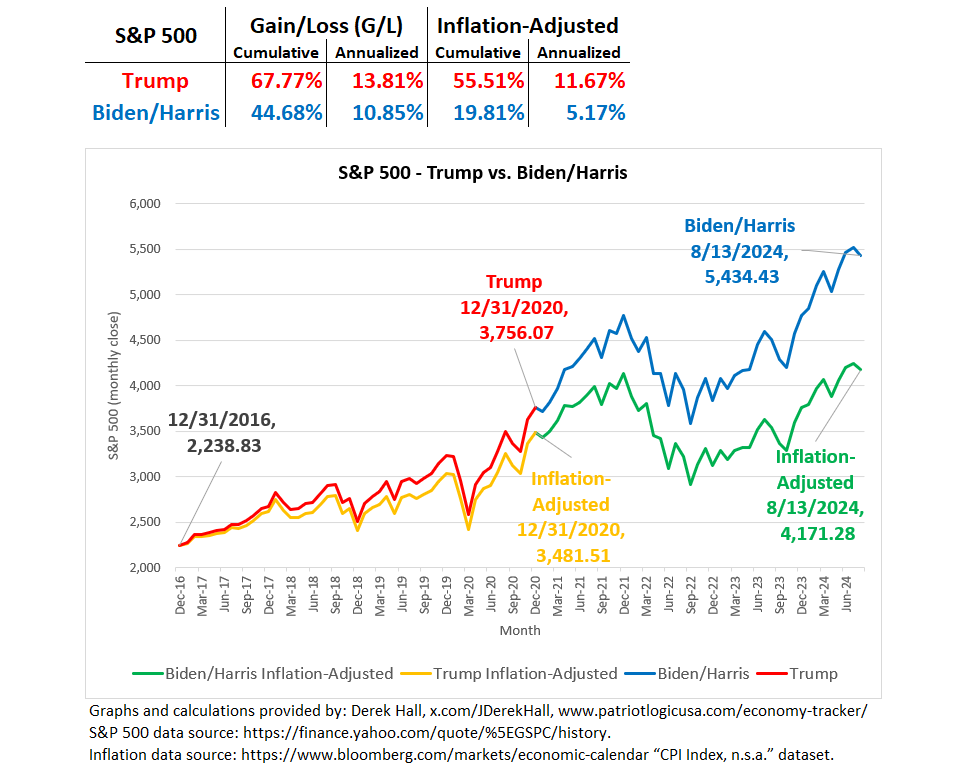
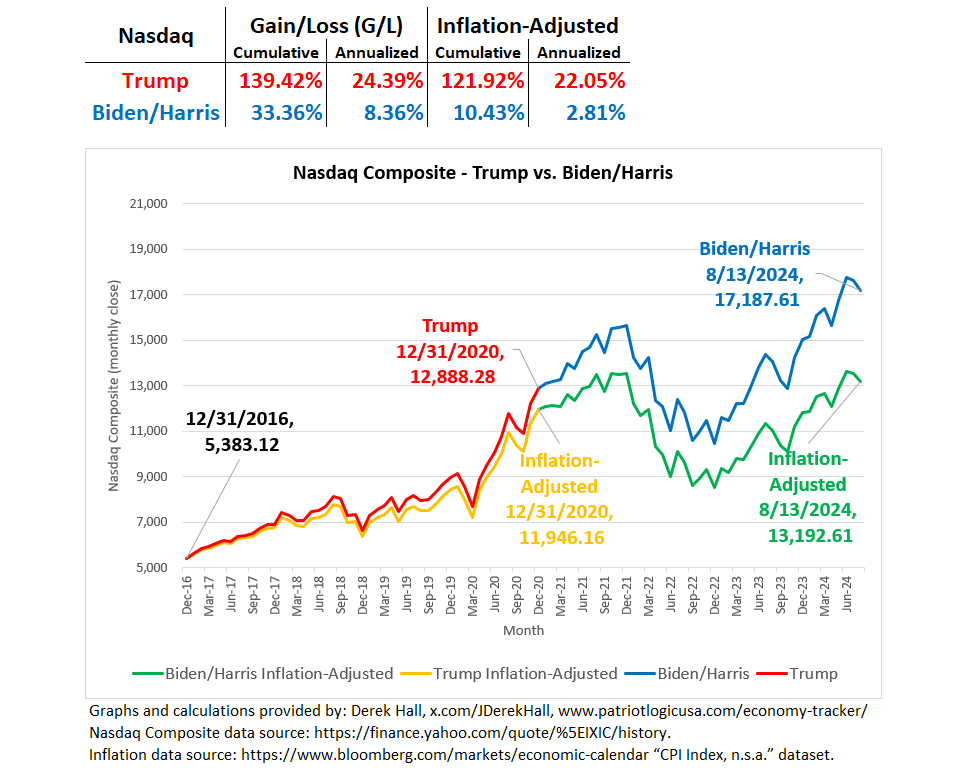
Stock Market: Trump vs. Biden/Harris
—————————————————————————————————
Inflation by Presidential Term (December 1969 to Present)
| President | Term | CPI | As of | Total CPI Inflation | Over [?] Months | Avg. CPI Annualized | Time Period Analyzed |
| Biden | 1st | 314.54 | July 2024 | 20.76% | 43 | 5.40% | Dec 2020 to July 2024 |
| Trump | 1st | 260.47 | Dec 2020 | 7.89% | 48 | 1.92% | Dec 2016 to Dec 2020 |
| Obama | 2nd | 241.43 | Dec 2016 | 5.15% | 48 | 1.26% | Dec 2012 to Dec 2016 |
| Obama | 1st | 229.60 | Dec 2012 | 9.21% | 48 | 2.23% | Dec 2008 to Dec 2012 |
| Bush 43 | 2nd | 210.23 | Dec 2008 | 10.47% | 48 | 2.52% | Dec 2004 to Dec 2008 |
| Bush 43 | 1st | 190.30 | Dec 2004 | 9.37% | 48 | 2.26% | Dec 2000 to Dec 2004 |
| Clinton | 2nd | 174.00 | Dec 2000 | 9.71% | 48 | 2.34% | Dec 1996 to Dec 2000 |
| Clinton | 1st | 158.60 | Dec 1996 | 11.77% | 48 | 2.82% | Dec 1992 to Dec 1996 |
| Bush 41 | 1st | 141.90 | Dec 1992 | 17.76% | 48 | 4.17% | Dec 1988 to Dec 1992 |
| Reagan | 2nd | 120.50 | Dec 1988 | 14.43% | 48 | 3.43% | Dec 1984 to Dec 1988 |
| Reagan | 1st | 105.30 | Dec 1984 | 22.02% | 48 | 5.10% | Dec 1980 to Dec 1984 |
| Carter | 1st | 86.30 | Dec 1980 | 48.28% | 48 | 10.35% | Dec 1976 to Dec 1980 |
| Ford | 1st | 58.20 | Dec 1976 | 17.81% | 29 | 7.02% | Jul 1974 to Dec 1976 |
| Nixon | 2nd | 49.40 | Jul 1974 | 16.24% | 19 | 9.97% | Dec 1972 to Jul 1974 |
| Nixon | 1st | 42.50 | Dec 1972 | 12.73% | 36 | 4.08% | Dec 1969 to Dec 1972 |
| 37.70 | Dec 1969 |
Additional table notes:
- “Total CPI Inflation” is the percent change in “CPI” during “Time Period Analyzed”.
- “Avg. CPI Annualized” equals “Total CPI Inflation” scaled geometrically to a 12-month period.
—————————————————————————————————